Thank you Denes, Richard, and Charlie for this amazing unit!
Data Visualisation Portfolio
Skill: Building a site and embedding charts
Skill: Hosting data
I built this using raw data
Find the JSON here.
I built this using an API
Find the JSON here.
Skill: Editing data and writing JSON by hand
This chart is built using raw data, after I added Sweden's observations to the CSV.Both charts use OECD Data
Find the JSON here.
This chart is built by adding data to the JSON file manually
Find the JSON here.
Skill: Scraping
I created this interactive chart after scraping data from YouGov
Find the workbook here.
Skill: Creating API driven charts
I built this chart using the World Bank API. I converted the XML format of the API to JSON before including it in the chart. Thank you Denes!
Find the JSON here.
I built this chart using the ONS API. It is interactive!
Find the JSON here.
Skill: APIs and Python Loops
The data in this chart was generated by 4 WorldBank APIs. I created the APIs on Google Colab and then downloaded the data as a CSV and manipulated it in Excel
Find the JSON here.
Find the Colab Book here.
Find the Colab Book for the FRED Data here! (I did World Bank simply because I found it more interesting). here.
Skill: Listening
After going to the Talking Economics Festival, I spent a good time thinking about when Sarah Smith mentioned that women's mental health suffered more than men's during the pandemic. This chart compares women's anxiety levels to men's, showing us that, on average, women's mental health was indeed doing worse than men's. Interestingly enough, the trend in changes in the GAD-7 score is similar for both genders, which peaked during June of 2020.
Find the JSON here.
Skill: Interactivity
Zoom in! (If this is not your cup of tea, I have two other interactive charts on my portfolio!)
Find the JSON here.
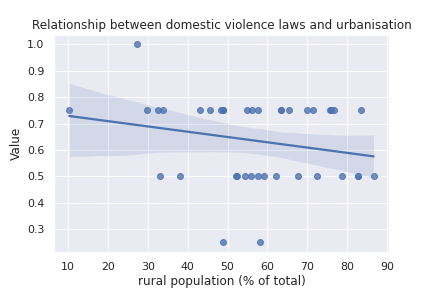
Skill: Data Analytics
This is related to my project, only done with rural as opposed to urban population %. We find an R² of 0.05, indicating no correlation between rural population and domestic violence laws index.The greater the index the greater the discrimination. The regression equation is y = -0.0 * x + 0.75
Find the workbook here.